
June 2, 2026
By David McKinney, Brenda Tuohy, Sam Berg, Courtney Ortega, and Yvonne Kao
This article first appeared in Science Scope, Volume 49, 2026, Issue 2: AI in the Classroom.
Big data is here and is only getting bigger. Students will need experience with big data to navigate a world suffused with it and, if they are interested, pursue one of a growing number of careers that require making sense of big data (National Center for Education Research, 2021). That is why we—a team of educators from Oakland Unified School District (OUSD) and researchers from WestEd, a nonprofit research organization—set out to create a data science unit that was engaging for middle school students in OUSD. While our work was situated in the context of a middle school computer science curriculum, we think that much of what we have learned can be applied to middle school science classrooms as well. Data science—a new interdisciplinary field that combines science, statistics, and computer science to answer questions with big data—cuts across domains like science, math, and computer science.
This might suggest that students can have data science experiences across the middle school curriculum, but in reality, each subject often leaves data science for the other subjects to cover, and then it is not covered by any subject. Our team is a Research Practice Partnership funded by the National Science Foundation’s Computer Science for All program (Award #2122485), and we are excited to share what we have learned with the science education community. We hope that the tools and routines we describe here can provide an onramp to incorporating data science into your science instruction.
Data Science Across the Curriculum
In our experience, the data science you might find in math class is in the statistics and probability unit. This unit is often at the end of the school year and, if it isn’t rushed through or skipped, doesn’t use big data and isn’t grounded in answering questions or solving problems. In computer science, data science is often secondary to programming apps and websites, even though there are Data and Analysis standards (Computer Science Teachers Association, 2017). For many computer science teachers, data science seems disconnected from other computer science topics and does not use big data (McKinney et al., 2024). In science, we observe students answering questions and solving problems with data, but not with big data containing thousands of observations. None of this is wrong or bad, but we do not believe it is preparing our students for their futures in a world suffused with big data.
Luckily for science teachers and students, the Next Generation Science Standards (NGSS) lays the foundation for including data science in science instruction. The Science and Engineering Practices (SEPs), especially Analyzing and Interpreting Data and Using Mathematics and Computational Thinking, are well aligned to the practices of data science. Much of what it takes to implement data science with middle school students is already in science teachers’ toolkits. What might be unfamiliar to science teachers and their students is where to find big data, how to make sense of the data, and what to do with it. Our team, which includes two former science teachers, has found tools and techniques that provide low-floor, high-ceiling experiences with big data for middle school students that we think can help middle school science teachers incorporate data science into their science instruction with ease. To demonstrate much of what we have learned, we will go through 1 of the 10 lessons we developed here and describe the choices we made, why we made them, and how they can be adapted to a science classroom.
Example Data Science Lesson
The sixth lesson in the unit—Data Visualization, Part II: Two or More Variables—focuses on visualizing data with two or more variables. It consists of a warm-up, two activities, a lesson synthesis, and a wrap-up (Table 1). In the warm-up, students observe a data visualization related to the prior lesson on data cleaning and record their observations in their notebooks. Students share with a partner before sharing them with the class. While students are sharing, the teacher records student responses on a class chart without judgment. This is an example of one of several routines we developed as a part of this project that were inspired by routines in the Illustrative Mathematics curriculum that the school district uses.
By using routines, we create predictability for teachers and students. This allows students to focus on what is important (e.g., noting a particularly interesting data visualization, making a connection to prior knowledge) rather than on a new procedure. This routine, called a Data Talk, and all the routines used in the unit are low floor and high ceiling, so all students can be successful and engage at a level that is comfortable for them. This means that in many ways, the routines allow for differentiation through students working at a level appropriate for themselves. When the teacher accepts all responses from this routine without judgment, students know it is a safe space to share their thinking. By repeating the routine throughout the unit, students become familiar with the procedure and are able to engage in thinking about what a visualization is instead of how the routine works.
Table 1. Lesson 6 Sequence, Description, and Suggested Timing
| Lesson activity & grouping suggestion | Description | Duration |
|---|---|---|
| Equipment | Internet-connected computers for each student or pair of students | – |
| Warm-Up Grouping: individual, pair | Students do a Data Talk about a data visualization that connects to the previous lesson. Students notice and wonder about the visualization and then do a think-pair-share. | 10–15 min |
| Activity 1 Grouping: individual, whole class | The teacher introduces the class party scenario and the desire to order a cake. Students do a Three Reads of Data to make sense of the data set. | 10–15 min |
| Activity 2 Grouping: individual, pair | Students create a data visualization of the cake preference data. | 10–15 min |
| Lesson Synthesis Grouping: individual, pair | Students use the data visualization to write an answer to the question: What kind of cake frosting should we get for our school party? | 10–15 min |
| Wrap-Up Grouping: individual | Students reflect on the lesson by responding to one of these prompts in their journals or orally: Something I heard today … Something I saw today … Something I wonder about … | 5 min |
The first activity after the warm-up presents students with a compelling scenario—they are planning a party for their class and want to order a cake for the party. In the scenario, data were collected from students about their cake preferences—what flavor of cake and what flavor of cake frosting they prefer. This scenario was chosen purposefully to be something that students would be familiar with and, hopefully, care about. Early in this project, we conducted focus groups to better understand what types of data questions students found interesting. They preferred data science learning related to their everyday experiences in school (Echeverria et al., 2023). In science classrooms, the challenge is to accomplish this while also attending to the standards you need to teach. We think this is possible by engaging students with data related to phenomena they have experienced firsthand (either through their daily experiences or from engaging in classroom explorations of phenomena) and framing questions about the data as locally as possible; ideally, generated by students.
After students are introduced to the scenario, they see data that contain responses from a survey about students’ favorite flavor of cake and their favorite flavor of cake frosting. The lesson calls for another routine—Three Reads of Data. We developed this routine after observing that students struggled to digest data sets that are new to them. We adapted this routine from the “Three Reads” Math Language Routine (Taylor, 2022; Zwiers et al., 2017), which is designed to help students make sense of a math word problem before attempting to solve it. In a similar fashion, Three Reads of Data supports students in taking the time to understand a data set before doing anything else.
On the first read, students look at the data set and answer the question, “What are these data about?” In this case, they might say cake, frosting, and party planning. They then look at the data set a second time. This time, they focus on answering, “What quantities do you notice?” After sharing out and having the teacher chart their answers, they respond to the third and final question, “What questions can I answer using these data?” This activity is also low floor, high ceiling, similar to a Data Talk. We use this routine each time a new data set is introduced to students.
In the second activity, students create data visualizations in the Common Online Data Analysis Platform (CODAP) to answer the question of what kind of cake and frosting to choose for a school party. CODAP is a free online tool for data analysis and visualization. We use this tool because it is easy for students to get started visualizing data while offering a wide range of capabilities as students explore and gain experience in the platform. In CODAP, teachers can drag and drop data into the platform and easily share it with students (and students can do the same if they find or produce their own data). Once data are in the platform, students are able to drag and drop variables into a data visualization.
Within a couple of minutes (or less), students can have a basic data visualization that shows them the distribution of each cake preference variable separately or the joint distribution of the two variables. With more tinkering, students can order categories on each axis, tabulate counts, and calculate percentages. Students explore the data using their visualizations and analyses to determine which cake to order. Having a simple-to-use tool allows for more focus on the visualization and what it tells you and less on how to use a complex tool. The cake preference data are structured to spur debate among students. If you look at each variable separately, you might come to a different conclusion than if you look at the joint distribution of the cake and frosting variables.
This is an important feature of the data because it means there is no one right answer and no one right way to get to an answer. As students explore, discuss, and share their visualizations, it is important to encourage healthy argumentation about how students arrived at different answers and what data they are using to support their answers. In one class session, two students were equally confident that they knew the preference of the class represented in the data. Each student did not understand how the other arrived at such a conclusion. The teacher pressed each student to share their visualization, why they chose that visualization, and how it led them to their answer. In the end, both students maintained their initial position, but they understood the other’s approach and rationale.
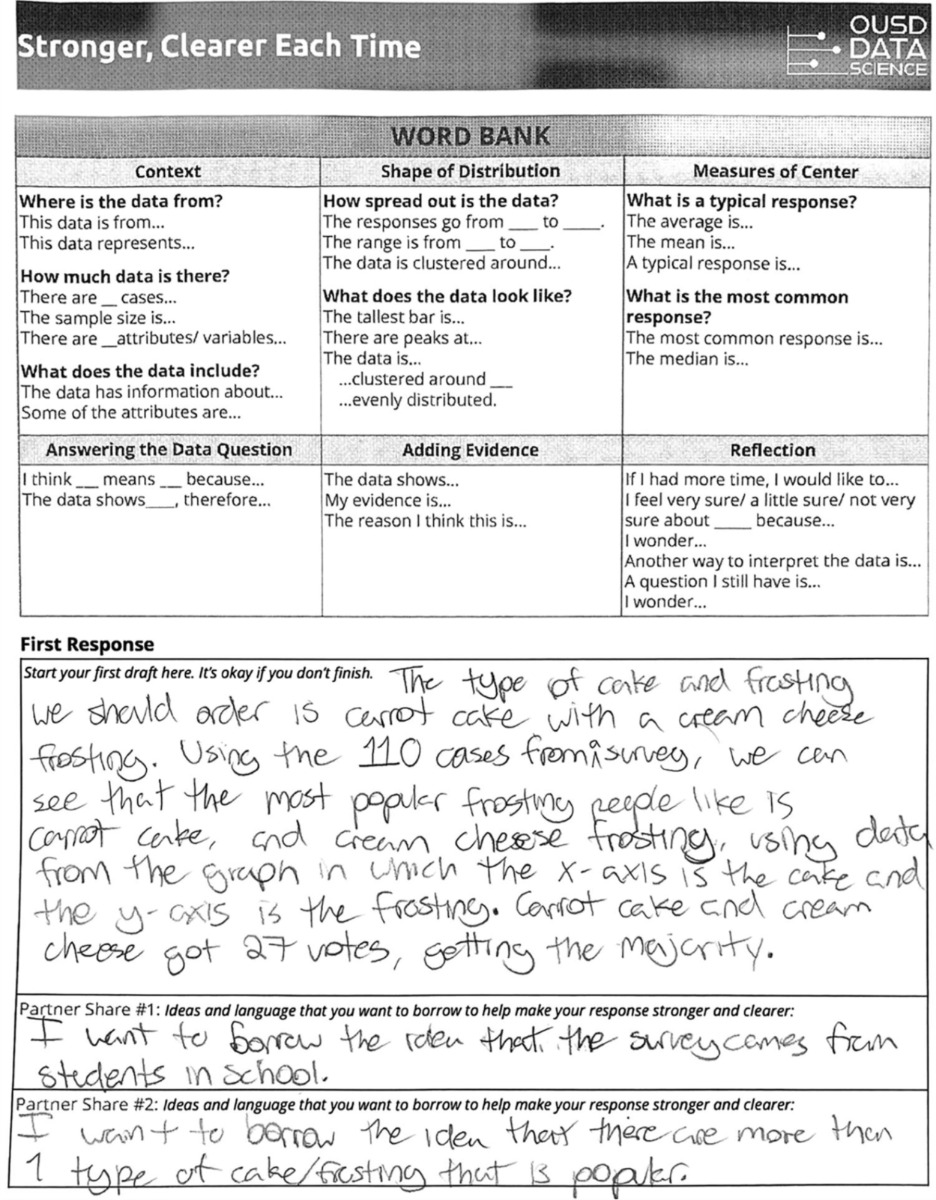
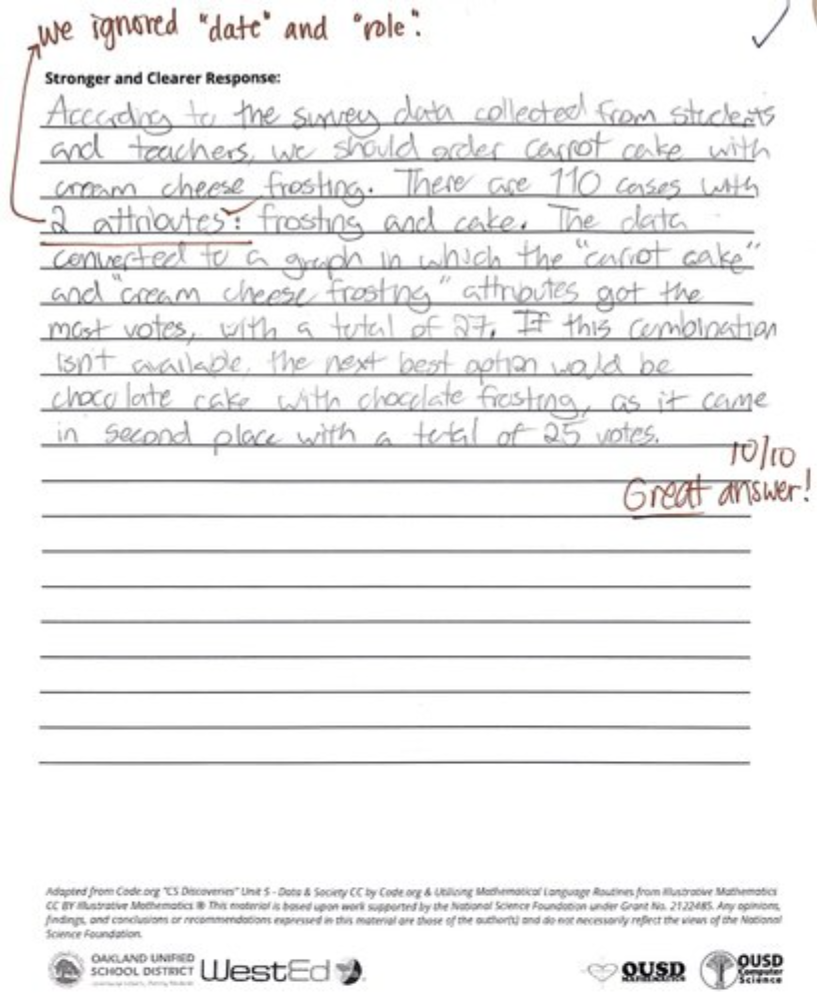
In the lesson synthesis, students are asked to decide what kind of cake with what kind of frosting the class should order, supported by data. This is well aligned with the Constructing Explanations and Designing Solutions SEP in the NGSS, middle school Common Core Math Statistics and Probability standards, and Common Core ELA standards for writing for technical subjects. We provide students with an organizer and word bank of words and sentence frames that may be useful to differentiate for students who may need that support at this stage in their learning (Figure 1). After writing the first draft of their explanation, the Stronger, Clearer Each Time routine structures peer feedback so that students can improve their explanations.
In this routine, students pair up and share their initial responses. Ideally, when students share their thinking, they do not read their response but instead describe their thinking. Their listening partner asks questions, presses for clarification and examples, and provides feedback. The partners switch roles so that both receive feedback. Students then switch partners and repeat the pair-share. These conversations give students an opportunity to hear other students’ ideas, clarify their own thinking, and add precision to how they communicate their thinking. They now return to their responses and write a second draft. Figure 1 shows one student’s initial draft, two ideas they wanted to borrow from each of their partners, and their revised drafts.
Again, we use routines to provide structured and familiar processes for students to engage in their work. This frees students up to do the important work we would like them to do in data science and in science instruction—communicating their thinking backed up by evidence. You can assess their thinking by examining their graphs and reading their explanations based on their graphs (see rubric in supplemental materials below).
FIGURE 1. Sample Word Bank and Student Work From the Stronger, Clearer Each Time Routine
Conclusion
If data science feels daunting to you, remember that the practices of data science are the same as the SEPs because data science is one of the many tools scientists and engineers use to make sense of the world and find solutions to problems. This means that science classrooms are a great place to introduce data science to students. Big data also allows students to connect the phenomena they are able to explore in the classroom with phenomena they don’t have access to. This promises to enhance students’ understanding of phenomena through rich exploration of data that puts students at the center of the exploration. With the right tools, like CODAP, and structures, like language routines, middle school students can understand and work with large data sets to explore phenomena and design solutions to problems.
References
- Computer Science Teachers Association. (2017). CSTA K–12 Computer Science Standards—Revised 2017.
- Echeverria, F., Kao, Y., & Hubbard Cheuoua, A. (2023). Using student and teacher feedback to modify CS curriculum. In M. Doyle & B. Stephenson (Chairs), SIGCSE 2023: Proceedings of the 54th ACM Technical Symposium on Computer Science Education V. 2 (p. 1420). Association for Computing Machinery, New York, NY, USA. https://doi.org/10.1145/3545947.3576364
- McKinney, D., Morton, C., Tuohy, B., Berg, S., Karlstad, A., Ortega, C., Allison, Z., Munzel, G., Washburn, M., & Kao, Y. (2024). Iterative design of a socially-relevant and engaging middle school data science unit. In B. Stephenson & J. A. Stone (Chairs), SIGCSE 2024: Proceedings of the 55th ACM Technical Symposium on Computer Science Education V. 1 (pp. 826–832).
- National Center for Education Research. (2021). Catalyzing a new field: Data science education in K–12. Institute of Education Science, U.S. Department of Education. https://ies.ed.gov/ncser/2025/01/catalyzing-new-field-data-science-education-k-12
- Taylor, K. (2022, February 17). Math language routines: Discourse with a purpose. Illustrative Mathematics. https://illustrativemathematics.blog/2022/02/17/math-language-routines-discourse-with-a-purpose/
- Zwiers, J., Dieckmann, J., Rutherford-Quach, S., Daro, V., Skarin, R., Weiss, S., & Malamut, J. (2017). Principles for the design of mathematics curricula: Promoting language and content development. https://ul.stanford.edu/resource/supporting-ells-mathematics
Supplemental Materials
- STUDENT ACTIVITY GUIDE Stronger, Clearer Each Time (PDF)
- STUDENT HANDOUT for 3 Reads Cake & Frosting Data Set excerpt 2 per sheet (PDF)
- LANGUAGE ROUTINE CARD Data Talk (PDF)
- STUDENT ACTIVITY GUIDE Three Reads of Data (PDF)
- LESSON_PLAN_Lesson_6_Visualizing_Data_Part_II (PDF)
- Data Rubric (Word document)
- LANGUAGE ROUTINE CARD Stronger, Clearer Each Time (PDF)
- MSDataScienceUnitOverviewCopyofSheet1 (PDF)
- Table 2 (Word document)
About the Authors
David McKinney is a senior research associate at WestEd in California. Brenda Tuohy is the Career and Technical Education Coach at the Oakland Unified School District in California. Sam Berg is the Computer Science Coordinator at the Oakland Unified School District in California. Courtney Ortega is the Secondary Math Coordinator for Middle Schools at the Oakland Unified School District in California. Yvonne Kao is Senior Director of Learning Sciences and Technology at WestEd in California.
This work was supported by the National Science Foundation under Award #2122485. Any opinions, findings, conclusions, or recommendations expressed in this blog post are those of the authors and do not necessarily reflect the views of the National Science Foundation.
Ready to Support Your Thriving Learners and Empowered Communities?
Connect with our WestEd experts.
"*" indicates required fields
More Related to This Post
Blogs & Podcasts
Research insights and stories designed to inform, engage, and inspire.


Events
Research insights and stories designed to inform, engage, and inspire.

Resources
Browse our high-quality publications and resources designed to inform and engage professionals in a variety of fields including K–12 education, early childhood, and health and justice.


